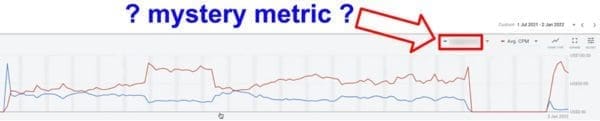
Look at this chart:
(It’s from a random campaign from our agency (Inceptly) with over $250k in adspend over this timeframe)
On the chart we have:
- Cost of traffic (Avg CPM, or average cost per 1000 impressions)
- Our “Mystery Metric”
Notice anything strange?
- When our “Mystery Metric” goes DOWN, cost of traffic goes UP.
And vice versa...
- When our “Mystery Metric” goes UP, cost of traffic goes DOWN.
It’s a nearly perfect inverse relationship.
So what is this “Mystery Metric’ that seems to determine, so perfectly, the cost of traffic?
What’s your guess?
Hit the comment to this blog post below and let us know your best guess!
- Today's post is brought to you by-

Are you spending over $1k/day on ads and looking to scale your business with YouTube ads?
Schedule your free YouTube strategy call here:  inceptly.com/call
What are your YouTube ad questions?
In the meantime, what questions do YOU have about YouTube ads?
Let us know in the Comments section below, and we’ll make sure to cover your question in an upcoming post.
Have a nice day!
The VidTao Team
Sign up for VidTao.com: The Free Tool to Discover & Track Your Market's Best YouTube Ads.
Are you spending over $1k/day on paid traffic and want to scale with YouTube ads? Schedule your free YouTube ad brainstorming call here: inceptly.com/call
VidTao.com is brought to you by Inceptly.com - High Performance YouTube Ad Creative & Media Buying Agency Managing $5M/month+ in YouTube Ad Traffic